PyData 库样式#
此主题对 PyData 生态系统中的几个主要可视化库内置了支持和特殊样式。这确保了这些库生成的图像和输出在浅色和深色模式下都看起来不错。以下是一些我们用作参考基准的示例。
Pandas#
[1]:
import string

import numpy as np
import pandas as pd

rng = np.random.default_rng(seed=15485863)
data = rng.standard_normal((100, 26))
df = pd.DataFrame(data, columns=list(string.ascii_lowercase))
df
[1]:
| a | b | c | d | e | f | g | h | i | j | ... | q | r | s | t | u | v | w | x | y | z | |
|---|---|---|---|---|---|---|---|---|---|---|---|---|---|---|---|---|---|---|---|---|---|
| 0 | 1.064993 | -0.835020 | 1.366174 | 0.568616 | 1.062697 | -1.651245 | -0.591375 | -0.591991 | 1.674089 | -0.394414 | ... | -0.378030 | 1.085214 | 1.248008 | 0.847716 | -2.009990 | 2.244824 | -1.283696 | -0.292551 | 0.049112 | -0.061071 |
| 1 | 0.175635 | -1.029685 | 0.608107 | 0.965867 | -0.296914 | 1.511633 | 0.551440 | -2.093487 | -0.363041 | -0.842695 | ... | -1.184430 | -0.399641 | 1.149865 | 0.801796 | -0.745362 | -0.914683 | -0.332012 | 0.401275 | 0.167847 | -0.674393 |
| 2 | -1.627893 | -1.132004 | -0.520023 | 1.433833 | 0.499023 | 0.609095 | -1.440980 | 1.263088 | 0.282536 | 0.788140 | ... | 1.330569 | 0.729197 | 0.172394 | -0.311494 | 0.428182 | 0.059321 | -1.093189 | 0.006239 | 0.011220 | 0.882787 |
| 3 | 0.104182 | -0.119232 | 1.426785 | 0.744443 | 0.143632 | 0.342422 | 0.591960 | 0.653388 | -0.221575 | -0.305475 | ... | -0.117631 | -0.705664 | -0.041554 | 0.365820 | 1.054793 | 0.280238 | -0.302220 | -1.105060 | -1.344887 | -0.186901 |
| 4 | 0.404584 | 2.172183 | -0.498760 | -0.537456 | -0.174159 | -0.421315 | -0.461453 | -0.456776 | -0.811049 | 0.470270 | ... | -0.970498 | -0.424077 | 0.017638 | 0.764396 | -0.055982 | 0.369587 | 0.566487 | -0.709265 | 0.041741 | 1.427378 |
| ... | ... | ... | ... | ... | ... | ... | ... | ... | ... | ... | ... | ... | ... | ... | ... | ... | ... | ... | ... | ... | ... |
| 95 | 0.730475 | 0.638252 | -1.327878 | 0.402921 | 0.300998 | -2.103696 | 0.177649 | 0.226409 | 0.391869 | -2.687118 | ... | -1.019080 | 0.449696 | 0.603108 | 1.325479 | -0.354819 | -0.122947 | -0.555267 | -0.319204 | 1.543449 | 1.219027 |
| 96 | -1.563950 | -0.496752 | -0.135757 | 1.468133 | -0.255600 | -0.551909 | 1.069691 | 0.656629 | -1.674868 | -0.192483 | ... | -0.197569 | 1.751076 | 0.536964 | 0.748986 | -0.631070 | -0.719372 | 0.053761 | 1.282812 | 1.842575 | -0.250804 |
| 97 | 0.116719 | -0.877987 | -0.173280 | -0.226328 | 0.514574 | 1.021983 | -0.869675 | -1.426881 | 1.028629 | -0.403335 | ... | -0.328254 | 1.291479 | 0.540613 | 0.876653 | -0.129568 | -0.756255 | 0.614621 | 0.747284 | -0.416865 | -1.230327 |
| 98 | 0.744639 | 1.312439 | 1.144209 | -0.749547 | 0.111659 | -0.153397 | -0.230551 | -1.585670 | -0.279647 | 0.482702 | ... | 1.193722 | -0.229955 | 0.201680 | -0.128116 | -1.278398 | -0.280277 | 0.109736 | -1.402238 | 1.064833 | -2.022736 |
| 99 | -2.392240 | -1.005938 | -0.227638 | -1.720300 | -0.297324 | -0.320110 | -0.338110 | -0.089035 | -0.009806 | 1.585349 | ... | 0.717063 | 0.589935 | 0.718870 | 1.777263 | -0.072043 | -0.490852 | 0.535639 | -0.009055 | 0.045785 | 0.322065 |
100 行 × 26 列
IPyWidget#
[2]:
import ipywidgets as widgets
import numpy as np
import pandas as pd
from IPython.display import display

tab = widgets.Tab()

descr_str = "Hello"

title = widgets.HTML(descr_str)

# create output widgets
widget_images = widgets.Output()
widget_annotations = widgets.Output()

# render in output widgets
with widget_images:
    display(pd.DataFrame(np.random.randn(10,10)))
with widget_annotations:
    display(pd.DataFrame(np.random.randn(10,10)))

tab.children = [widget_images, widget_annotations]
tab.titles = ["Images", "Annotations"]

display(widgets.VBox([title, tab]))
Matplotlib#
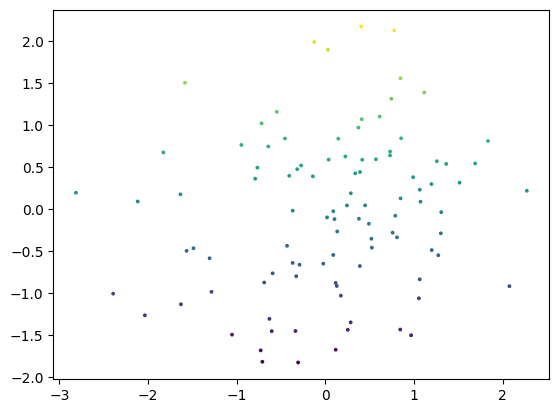
[3]:
import matplotlib.pyplot as plt

fig, ax = plt.subplots()
ax.scatter(df["a"], df["b"], c=df["b"], s=3)
[3]:
<matplotlib.collections.PathCollection at 0x7f5bc15a7af0>

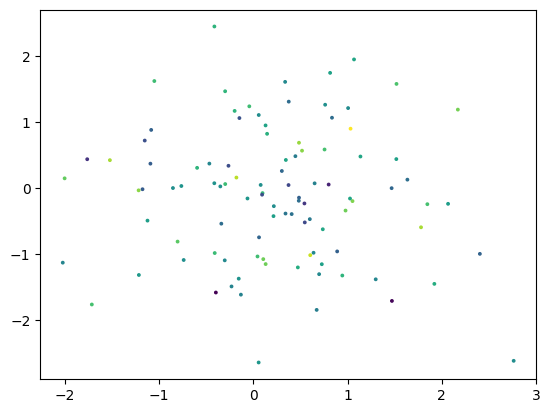
[4]:
rng = np.random.default_rng()
data = rng.standard_normal((3, 100))
fig, ax = plt.subplots()
ax.scatter(data[0], data[1], c=data[2], s=3)
[4]:
<matplotlib.collections.PathCollection at 0x7f5bbf454b50>

Plotly#
下面的 HTML 不应该显示,但它使用 RequireJS 来确保一切按预期工作。如果小部件没有显示,则 RequireJS 可能已损坏。
[5]:
import plotly.express as px
import plotly.io as pio

pio.renderers.default = "notebook"

df = px.data.iris()
fig = px.scatter(df, x="sepal_width", y="sepal_length", color="species", size="sepal_length")
fig
Xarray#
这里我们演示了 xarray 以确保它能正常显示。
[6]:
import xarray as xr

data = xr.DataArray(
        np.random.randn(2, 3),
        dims=("x", "y"),
        coords={"x": [10, 20]}, attrs={"foo": "bar"}
      )
data
[6]:
<xarray.DataArray (x: 2, y: 3)> Size: 48B
array([[-1.40235756, -0.16240482, -0.67925026],
       [-0.03925222,  0.41446933, -0.5100787 ]])
Coordinates:
  * x        (x) int64 16B 10 20
Dimensions without coordinates: y
Attributes:
foo: baripyleaflet#
ipyleaflet 是一个 **Jupyter** / **Leaflet** 桥,它在 Jupyter 笔记本环境中启用交互式地图。这演示了如何在文档中集成地图。
[7]:
from ipyleaflet import Map, basemaps

# display a map centered on France
m = Map(basemap=basemaps.Esri.WorldImagery,  zoom=5, center=[46.21, 2.21])
m
[7]: